The answer’s already
in your data.
Rheos Inspect brings SCADA, GIS and spreadsheet exports together, so you can find it without rebuilding a spreadsheet every time.
Get early accessNight flow starts climbing — 14 days before it was spotted.
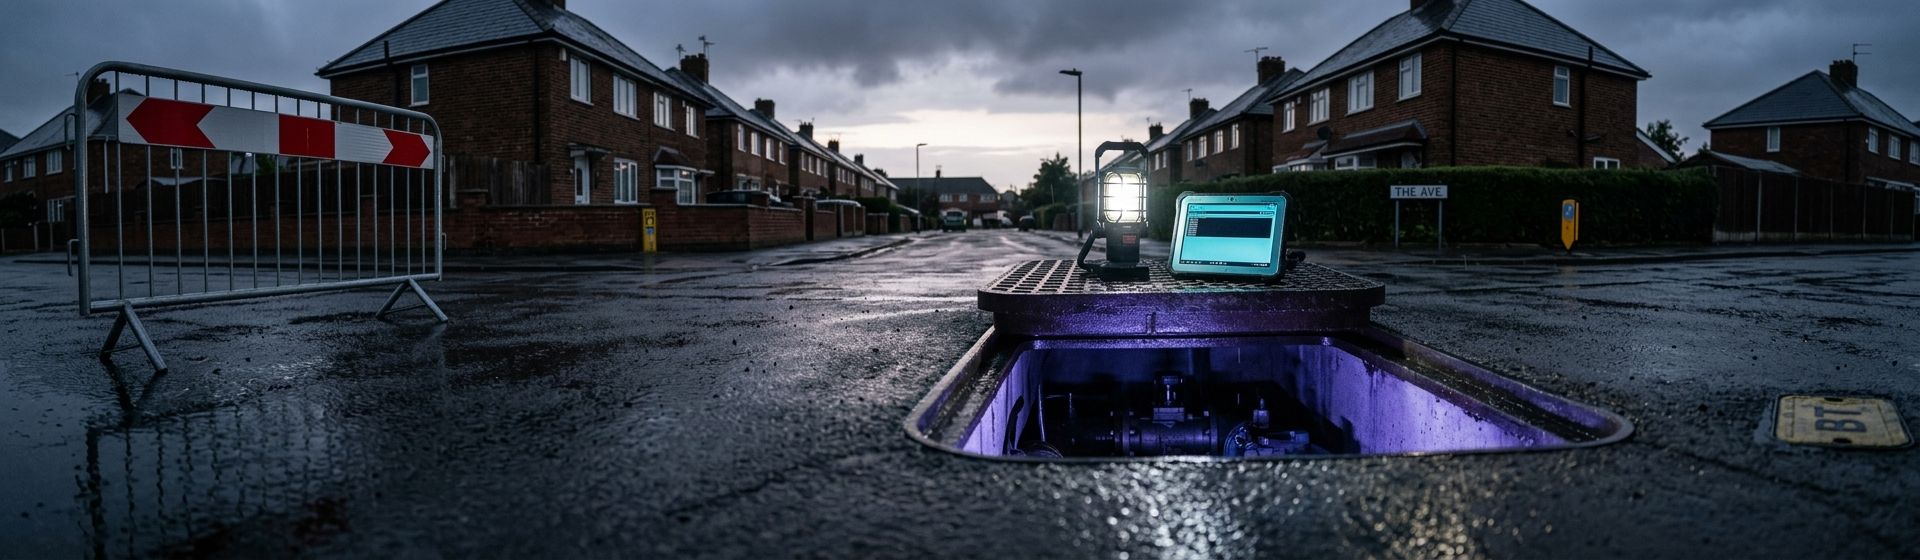
Every question starts from scratch.
Water network data sits in SCADA, GIS, ERP and a hundred spreadsheets that were never built to talk to each other. Answering one question means rebuilding the same view again.
And when the person who built that spreadsheet leaves, the knowledge goes with them.

What you can ask it
Where’s the night flow going?
Minimum night flow against baseline, zone by zone.
Why is this zone discolouring?
Turbidity and complaint volume, against shear stress.
Is pressure behind these complaints?
Zone pressure over time, against complaint clusters.
Does supplied match billed?
Supplied volume against billed consumption.
How it works
Upload your data
Drop in a CSV from SCADA, a GIS export, or a spreadsheet.
Check what came in
A coverage matrix shows which signals landed, and any gaps.
Ask a question
Pick a view, or start from a suggested analysis.
Investigate together
Work through it with the data alongside you.
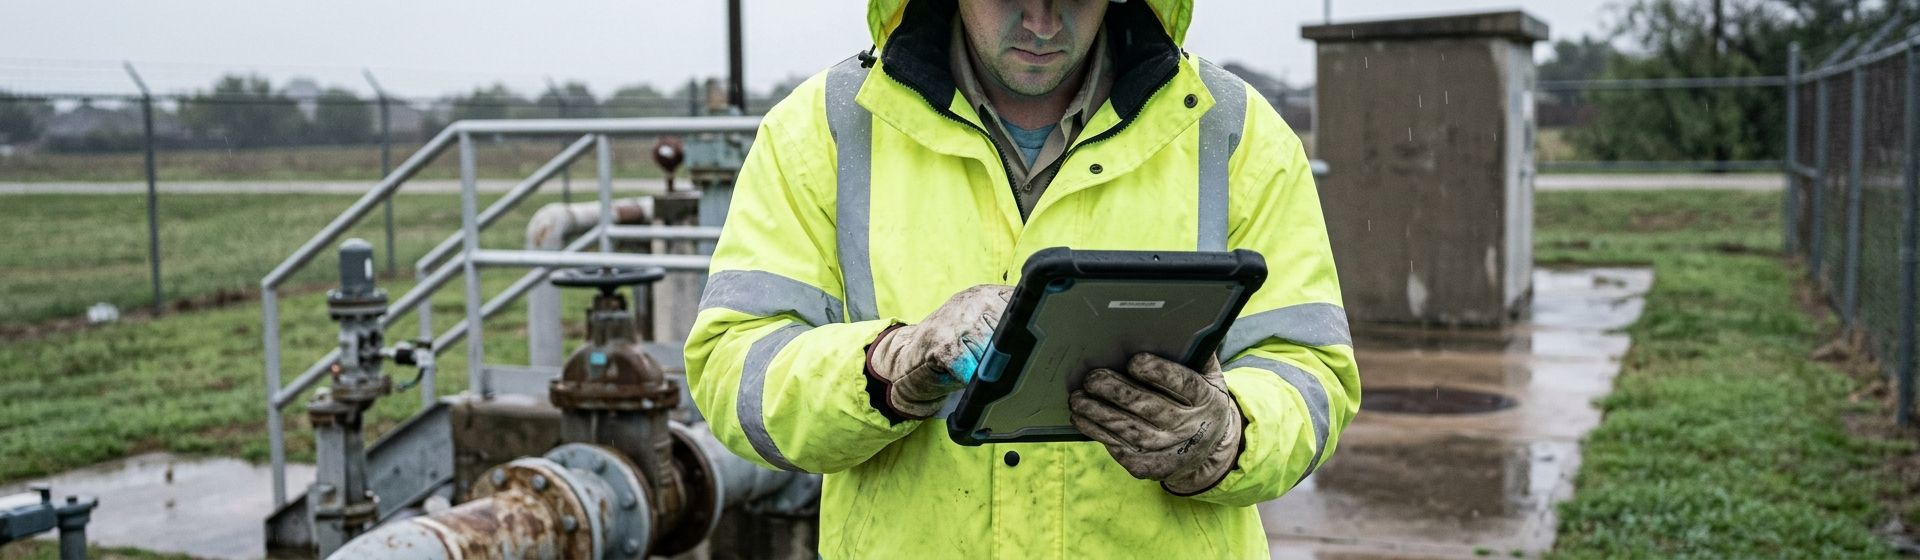
Get early access
We’re building Rheos Inspect now. Tell us the question you keep having to rebuild, and we’ll keep you posted.